
B2B SaaS Customer Acquisition Cost: 7 Proven Strategies to Slash Your Burn
The Definitive Unit Economics Efficiency Playbook for Modern B2B Founders, CMOs, and Revenue Growth Engineers.
The B2B SaaS landscape in 2026 operates on a cold, unyielding reality: growth-at-all-costs is officially dead. Driven by a 164% surge in Google Ads CPC and an 89% spike in LinkedIn advertising costs over recent years, the median B2B SaaS company now spends $2.00 to generate $1.00 of new Annual Recurring Revenue (ARR). The average blended customer acquisition cost (CAC) has climbed to an intense $1,200 per customer, representing a massive 60% macro-inflation over the past five years.
When capital markets prioritize capital efficiency, margins, and the Rule of 40 over vanity traffic, mastering your unit economics isn't just an exercise for your next board deck—it's a requirement for corporate survival. This comprehensive guide breaks down how to calculate your true CAC (without the common accounting traps), evaluates the latest 2026 industry benchmarks, and provides an actionable operational framework to structurally lower your CAC while scaling revenue velocity.
Table of Contents
- 1. What is B2B SaaS Customer Acquisition Cost (And Why It's Distorted)?
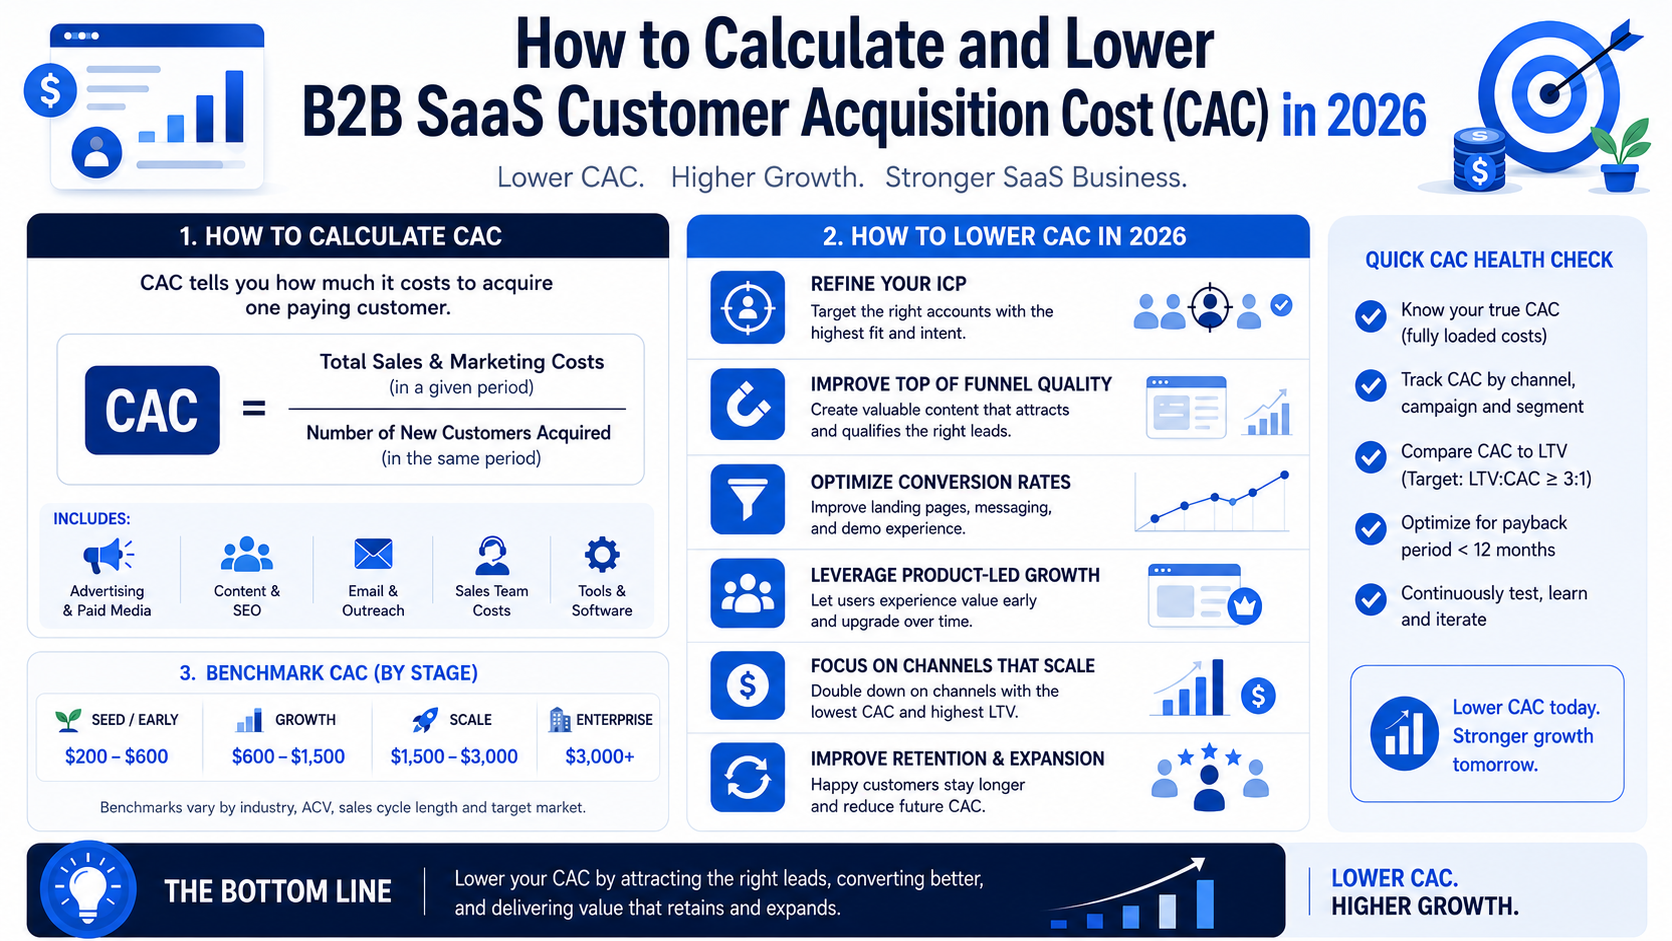
- 2. The True B2B SaaS CAC Calculation Formula
- 3. The Critical Timing Mismatch & Account-Based Adjustments
- 4. 2026 B2B SaaS CAC Benchmarks by Segment & Vertical
- 5. The Unit Economics Safe Zone: LTV:CAC and Payback Periods
- 6. 7 Advanced Strategies to Lower B2B SaaS Customer Acquisition Cost
- 7. Frequently Asked Questions (FAQ)
1. What is B2B SaaS Customer Acquisition Cost (And Why It's Distorted)?
At its most fundamental level, B2B SaaS Customer Acquisition Cost represents the total fully loaded financial investment required to convince an organization to purchase your software product. However, many early-to-mid-stage SaaS growth teams miscalculate this number. To make marketing performance look more favorable on weekly internal syncs, teams frequently isolate only "direct digital ad spend" against new user signups.
This creates an artificially deflated, vanity metric that hides structural operational burn. Real B2B customer acquisition involves multi-channel journeys, complex buying committees, and extensive human intervention. If your operational dashboard ignores your Sales Development Representative (SDR) salaries, the cost of your revenue operations software stack, or the onboarding specialist's overhead, you aren't tracking your real metrics—you are simply evaluating ad platform click distribution.
When managing capital allocation, reducing your core B2B SaaS Customer Acquisition Cost requires a complete baseline audit of team structures. If teams fail to audit these parameters quarterly, software operations run into programmatic inefficiency issues that choke marketing ROI scalability pipelines entirely.
2. The True B2B SaaS CAC Calculation Formula
To capture the true economic reality of your growth machine, you must accurately process the fully loaded B2B SaaS Customer Acquisition Cost mathematical formula. This equations balances every single dollar spent specifically to attract, nurture, qualify, and close a business logo over a given timeframe against the exact volume of customers won.
Breaking Down the Inputs: What to Include
- Direct Paid Media Spend: Performance capital deployed across Google Search, LinkedIn Ads, Meta Retargeting, programmatic ABM platforms (e.g., Demandbase, 6sense), and sponsored industry newsletters.
- Sales & Marketing Salaries: Total gross compensation, commissions, performance bonuses, and benefits for your CMO, VPs, Account Executives (AEs), SDRs, Content Marketers, and growth engineering staff.
- MarTech & Sales Tooling Stack: Software licenses that exist purely to fuel demand and sales enablement (e.g., Salesforce/HubSpot CRMs, ZoomInfo, Tomba for data enrichment, ocean vectors, attribution software, and marketing automation seats).
- Agency and Contractor Fees: External creative agency retainers, SEO consultants, performance marketing freelancers, and specialized design partners like Creativephy.
- Onboarding & Professional Services CoGS: If your product requires custom technical setup, data migration, or training to cross the line into a closed-won ARR state, those initial hours must be factored in.
3. The Critical Timing Mismatch & Account-Based Adjustments
The single most common mathematical error in SaaS growth metrics is failing to account for sales cycle time lag. If your average enterprise sales cycle is 134 days (the 2026 B2B average), the enterprise accounts that close in your current quarter are the product of marketing capital deployed and SDR outreach executed two full quarters prior.
To calculate B2B SaaS CAC with time lag accurately, adjust your formula to shift the marketing numerator backward by the exact duration of your median sales cycle. For example, if your average sales cycle is 90 days, divide your total Sales and Marketing expenditures from Q1 by the total number of new customers closed in Q2. Matching spend cohorts directly to closed cohorts prevents artificial monthly swings in your unit economics.
Segmenting Your CAC For Clearer Visibility
A blended corporate CAC often obscures where your cash is performing best. High-growth teams segment their calculations into three core buckets:
- By Tier/Segment: Keep your Enterprise CAC distinct from your SMB or mid-market metrics.
- By Go-To-Market (GTM) Motion: Segment Product-Led Growth (PLG/self-serve) costs away from high-touch Sales-Led Growth (SLG) frameworks.
- By Core Channel: Track paid acquisition CAC completely independent of organic content, SEO pipelines, and partnership referral loops.
4. 2026 B2B SaaS CAC Benchmarks by Segment & Vertical
To accurately assess whether your current spend is highly efficient or unsustainably elevated, benchmark your performance against current macroeconomic figures. The 2026 private SaaS market reveals a wide variance in customer acquisition costs based on target verticals, contract value, and execution models:
| Industry Vertical / Motion | Median CAC | Standard Range | Avg. Sales Cycle Length |
|---|---|---|---|
| Product-Led / Self-Serve (PLG) | $400 | $100 – $600 | 1 – 14 Days |
| HR Tech | $410 | $200 – $800 | 45 – 60 Days |
| MarTech / Sales Tools | $520 | $300 – $900 | 60 – 90 Days |
| Developer Tools (DevTools) | $380 | $200 – $600 | 30 – 45 Days |
| Cybersecurity / InfoSec | $1,100 | $600 – $2,500 | 90 – 150 Days |
| FinTech (B2B) | $1,450 | $600 – $4,900 | 120 – 180 Days |
| Enterprise Sales-Led (Mid-Market/Ent) | $4,000 | $2,000 – $10,000+ | 120 – 210 Days |
*Note: Data compiled from recent 2026 B2B SaaS performance marketing datasets, public cloud indexes, and authoritative research dashboards processed by OpenView Industry Benchmarks.
5. The Unit Economics Safe Zone: LTV:CAC and Payback Periods
Evaluating your internal corporate B2B SaaS Customer Acquisition Cost metrics should never be done in a complete organizational vacuum. It must always be directly balanced against two critical guardrail metrics: Customer Lifetime Value (LTV) and the CAC Payback Period.
- Below 1.1x LTV:CAC: You are burning precious runway and losing money on every single customer acquired.
- 3.0x to 3.5x LTV:CAC: The health safe zone for highly sustainable venture-backed or bootstrapped SaaS execution.
- CAC Payback Period Rule: Tracks the exact number of months a customer must remain active just for your company to break even on the cash deployed to win them. In 2026, premium self-serve PLG models aim for an 8 to 12-month payback window, while enterprise scales can extend up to 24 months.
6. 7 Advanced Strategies to Lower B2B SaaS Customer Acquisition Cost
If your current customer acquisition costs are straining your cash runway, simply cutting your budget isn't the solution—that often drops revenue proportionally. Instead, you need to systematically strip out programmatic waste and optimize conversion infrastructure.
Strategy 1: Transition from Percentage-Based Agency Fees to Retainers
Many performance marketing agencies charge a variable fee structure tied directly to your total ad spend (typically 15-20%). This model incentives the agency to spend more of your capital, regardless of direct unit profitability. Shift your digital marketing agency agreements to flat monthly retainers or performance-tied tiers to keep incentives aligned.
Strategy 2: Execute Competitor Conquesting with High-Intent Content
Rather than bidding blindly on hyper-competitive generic keywords like "best CRM platform," build targeted competitor comparison frameworks (e.g., "YourBrand vs. CompetitorX"). Sourcing high-intent search traffic via structured SEO campaigns converts at a significantly higher rate from MQL to SQL.
Strategy 3: Tighten ICP Using Strict Behavioral Filters
Audit your historic closed-won CRM accounts over the last 24 months. Identify the specific micro-cohorts that showcase the shortest sales cycles and highest retention rates. Use these traits to narrow your programmatic ABM targeting parameters across LinkedIn and Google.
Strategy 4: Programmatic Top-of-Funnel Pipeline Automation
Manual sourcing, list-building, and manual data input by outbound SDR teams is an expensive use of human capital. Reduce this friction by automating data validation and prospecting pipelines. Utilizing API-driven data enrichment engines dramatically drops your cost-per-meeting.
Strategy 5: Fix Mid-Funnel Leaks with Heuristic CRO
Most software companies have a conversion optimization problem, not a traffic problem. Improving your website's baseline conversion rate from 2% to 4% by eliminating redundant form fields and speeding up page response times effectively halves your paid media CAC instantly.
Strategy 6: Expand the Product-Led Growth (PLG) Self-Serve Loop
Analyze if lower-tier customer accounts can be shifted into a self-serve, freemium, or automated trial path. By removing human touchpoints for lower contract value users, you preserve AE time exclusively for premium deals.
Strategy 7: Expand Account Value to Drastically Improve Ratios
Lowering acquisition costs can also be accomplished from the retention side. By improving your digital product onboarding experience, you actively mitigate early customer churn. Every percentage point added to your Net Revenue Retention (NRR) balances high upfront acquisition costs.
7. Frequently Asked Questions (FAQ)
What is a good CAC for B2B SaaS?
A good CAC depends on your average annual contract value (ACV) and target market. For SMB-focused SaaS, a median CAC of $100 to $500 is typical. For complex enterprise-grade software with long sales cycles, a CAC ranging between $2,000 and $5,000+ is common, provided it maintains an LTV:CAC ratio safely above 3:1.
How does sales cycle length impact overall CAC?
Sales cycle length directly scales your CAC because time requires human capital. Every month a deal remains open in your sales pipeline, it accumulates additional overhead costs in the form of sales rep salaries, administrative CRM tools, and continuous retargeting ad impressions.
Should Customer Success salaries be factored into CAC?
If your Customer Success team focuses entirely on retention, account health, and renewals, their compensation belongs in Cost of Goods Sold (CoGS). However, if your onboarding specialists are required to handle technical implementations just to get a newly closed contract live and billable, that specific onboarding cost should be included in your fully loaded CAC.
Strategic Next Steps for Scaling Agencies & Platforms
Optimizing your unit economics requires a methodical look at your performance data, your positioning, and your tech stack. If you run a digital marketing or growth operation like Creativephy Services, helping your SaaS clients accurately track and lower their acquisition costs is one of the highest-value services you can deliver.
Ready to Eliminate Wasted Performance Ad Spend?
Let our growth experts run a comprehensive, multi-channel performance marketing audit to uncover hidden pipeline leaks and structurally optimize your B2B unit economics.
Book a Growth Audit Strategy Call →